The Capital Asset Pricing Model (CAPM) identifies the link between systemic risk and projected asset return. The goal of the CAPM is to determine whether an investment is fairly valued by comparing risk and expected return.
A framework for calculating the needed rate of return on an asset is provided by the Capital Assets Pricing Model (CAPM), which also shows how an asset’s return and risk are related. The CAPM-specified required rate of return aids in determining an asset’s value.
Assumptions of Capital Assets Pricing Model (CAPM)
1. Market efficiency
The efficiency of the capital market requires that share prices represent all information. Additionally, small-scale investors have no control over stock prices. This indicates that a lot of investors own modest amounts of money.
2. Risk aversion
Investors avoid taking risks. The expected return and variance, or standard deviation, are used to analyze a security’s risk and return, respectively.
3. Homogeneous expectations
All investors have similar expectations regarding the projected return and security threats.
4. Single time period
Each investor bases their selection on a specific time frame.
5. Risk-free rate
All investors are able to lend and borrow money at a risk-free interest rate.
Systematic and Unsystematic Risk
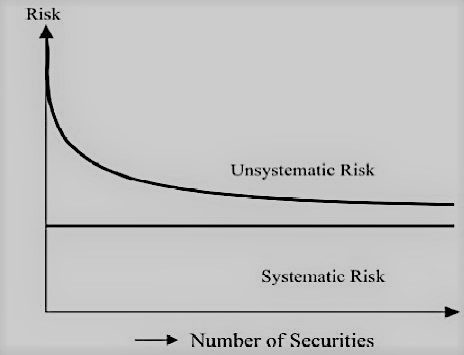
Prior to understanding the Capital Asset Pricing Model (CAPM), we need to understand the nature of risks. The diversification of a portfolio reduces the risk of individual securities. If the number of securities is very large, risk totally vanishes, but the risk represented by covariance still remains. So there are two types of risk: systematic risk, which is non-diversifiable, and unsystematic risk, which is diversifiable.

1. Systematic Risk
Systematic risk develops as a result of the uncertainties that affect the entire economy and the propensity of individual assets to fluctuate along with market developments. Diversification cannot lessen this aspect of risk. Market risk is another name for it. Even when an investor holds a well-diversified portfolio of securities, they are still subject to market risk. For example, the government adjusts its interest rate policy.
Systematic risks are economy-wide uncertainties like changes in interest rate policy, inflation rates, and government taxes. Diversification of a portfolio can’t reduce the systematic risk as it moves together with the change in the market. This is also known as market risk.
2. Unsystematic Risk
The particular uncertainties of individual securities give rise to unsystematic risk. It also goes by the name Unique risk. If many securities are pooled to create well-spread portfolios, these uncertainties can be diversified. Individual securities’ uncertainties cancel each other out in a portfolio. Thus, diversification can completely cut down on unsystematic risk.
For example, the company’s employees go on strike, and it loses a significant contract in a bid.
The unsystematic risks are caused by the unique uncertainties of individual securities, and these can be reduced through diversification.
Sensitivity Coefficient (β)
Hence, the risk of an individual security is either the systematic risk or the market risk, because the unsystematic risk can be reduced by the method of diversification. The return of risky security can be correlated with the volatility of the security’s return in relation to the return of the market. This volatility is measured as beta (β), which corresponds to the return of individual security when the return on the market portfolio swings. The line shown in the chart below is known as the Characteristics Line, and its slope is called beta (β).

Security Market Line (SML)
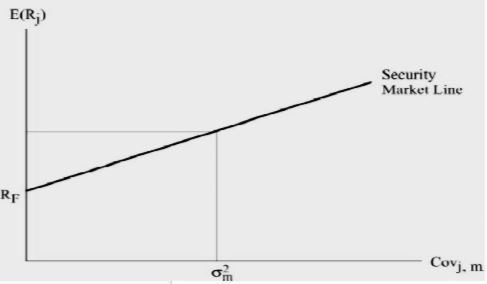
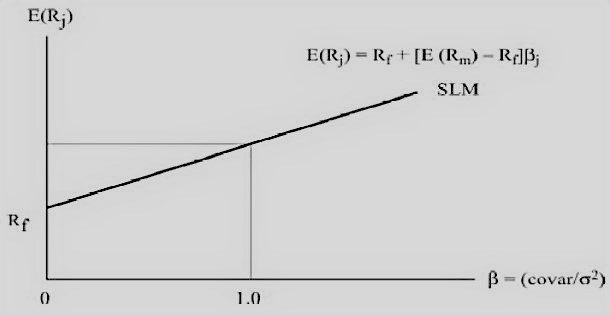
The Security Market Line (SML) represents the expected return of an individual asset with its associated risk. The Y-intercept represents the risk-free interest rate, the x-axis represents the systematic risk and the slope of SML gives the market risk premium.

Security Market Line (SML) with normalized risk (β):

To calculate the expected return using CAPM, we use the following equation:
E(Rj) = Rf + (E(Rm) − Rf)βj
where:
E(Rj) = expected return of investment
Rf = risk-free rate
βj = beta of the investment
E(Rm)−Rf = market risk premium
Significance of Capital Asset Pricing Model (CAPM)
The aim of the Capital Asset Pricing Model (CAPM) formula is to assess the fair value of a stock in comparison with the anticipated value of its risk and its time value of money. Imagine an investor today is planning to pay a 3% dividend stock worth $100 per share. The stock has a beta of 1.3, so it is riskier than a market portfolio. Assume that the risk-free rate is 3% and this investor anticipates that the market will increase by 8% annually. In the format of CAPM, the expected return on the stock is 9.5%:
9.5%=3%+1.3× (8%−3%)
In order to reduce the expected stock dividends and the capital appreciation over the expected holding time, the intended return of the CAPM formula is used. The CAPM formula states that if the discounted value for future cash flows is $100, the stock is fairly valued as a result of the risk.


